Information graphics or
infographics are graphic visual representations of information, data or
knowledge. Information graphics surround us for a long time. We commonly see
infographics in newspaper to show the weather, as well as maps and site plans,
and graphs for statistical data etc. Further to the study of INF506, I found
that infographics are commonly used on web and there are free online tools to generate infographics.
I think infographics
are commonly used todays because people can present complex information quickly
and clearly in graphics which represent/communicate concepts using a single
symbol to process information. Previously, information graphics are used
heavily in children’s books of visualized goodness but now we can get concepts
by infograhics. Here I show examples of visualized concepts below.
Pinterest [Infographic]
I know Delicious but
there is another social bookmarking site “Pinterest” for a year but I have lack
of knowledge on using it (I don’t have Pinterest account). Then I conduct the
web search and try to learn quickly about Pinterest. It’s great to retrieve
many infographics to represent “Pinterest”. It is interesting to learn new
things by graphics. When you click “source” provided in the infographic, you
may direct to the original article to read the text and the image. For example,
you may click “source” on the bottom of the attached [infographic] that
will redirect you to “A
guide to use Pinterest for business [Inforgraphic].
 | |||||||||||||||||||||||||||||||||||||||||||||||
| Source: A guide to use Pinterest for business [Inforgraphic] |
Internet
[Infographic]
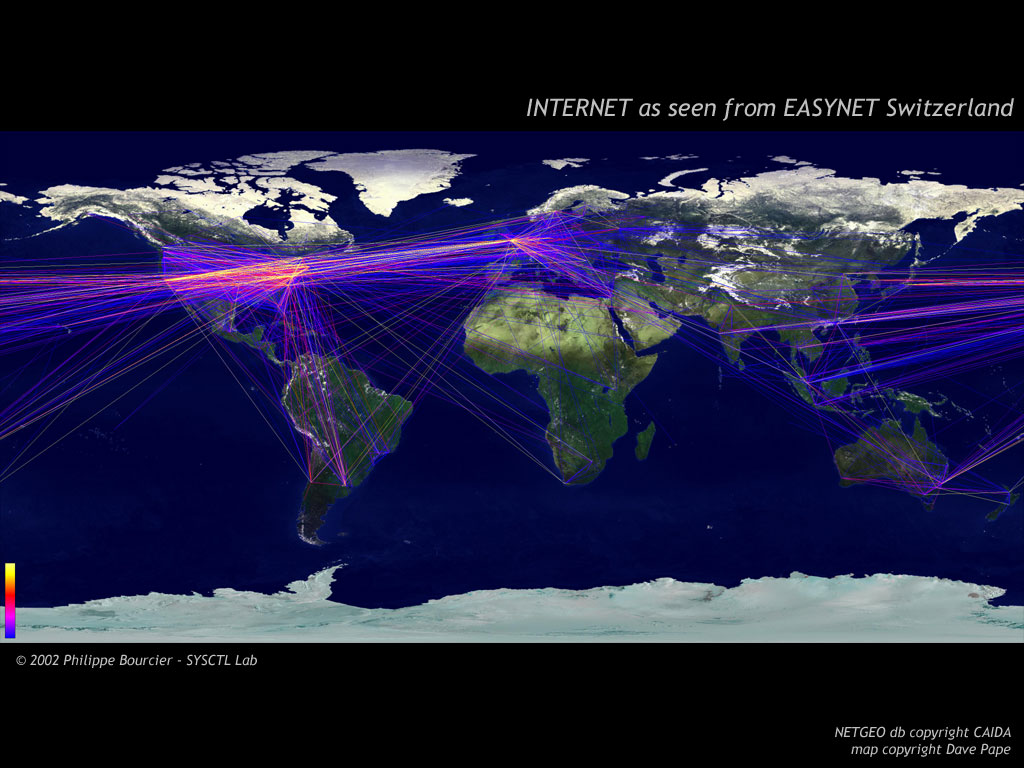
There is another example shows the user
of infographic. Internet, is a worldwide network of computers, which is made of
a lot of different components: Websites users, services, browser, networking
cables…It is hard to conceptualize the component of internet. Even some of them
are physical component but some of them do not.“Mapping the internet”
demonstrates the visual representation of Internet by Infographic.

Education
[Infographic]
It seems that “Infographic” can
represent different topics. Dunn (2012) have been saving up all of his favorite
infographics and picked each infographic based on the topic. Let’s see the visualized concepts of
education represented by infographics.
The above of three examples demonstrated
the use of infographics which can represent information in visualization and post
on social networking tools to increase the attractiveness of the content.
Infographics on education may help teaching and learning, as well as enhance
the interactive and attractiveness on education. Here is an interesting information
graphic shows the history
of education.
 |
|
Source: The history of education
[infographic]
From: http://www.avatargeneration.com/2013/02/the-history-of-education/ |
It has added more fun and interest to
have [infographic] in the content of both web publishing or print materials.
No comments:
Post a Comment